A Mutable Log
A blog by Devendra Tewari
Project maintained by tewarid Hosted on GitHub Pages — Theme by mattgraham
Using Python to analyze data in a PDF file
The state university my daughter wants to study at just announced their entrance exam results via a PDF file. I wanted to get additional insights from the data, and decided it was time to use Python—I’ve got Jupyter Notebook installed on macOS—to do the data extraction and analysis.
I needed to install a few additional packages for python 3
pip3 install pdftotext pandas matplotlib
First, I created an empty DataFrame with the three columns I needed
import pandas as pd
columns = ['id','name', 'result']
df = pd.DataFrame(columns=columns)
Next, I read text data from the PDF
import pdftotext
with open('SSA1_2018_Publicacao_v4.pdf', 'rb') as f:
    pdf = pdftotext.PDF(f)
print(len(pdf))
Next, I parsed the text data into the DataFrame
k = 0
for i in range(len(pdf)):
    lines = pdf[i].split('\n')
    for j in range(3, len(lines) - 3, 1):
        words = lines[j].split()
        idn = words[0]
        name = ' '.join(words[1:-1])
        if not name:
            continue
        result = float(words[-1].replace(",", "."))
        if result == 0.0:
            continue
        df.loc[k] = [idn, name, result]
        k = k + 1
print(k)
Next, I sorted the DataFrame by the result column to find the top scorers
df=df.sort_values(by=['result', 'name'])
print(df.tail())
Next, I grouped students by their score to find how many had the same score as my daughter’s
df_grouped = df.groupby(by='result')['result'].count()
print(df_grouped)
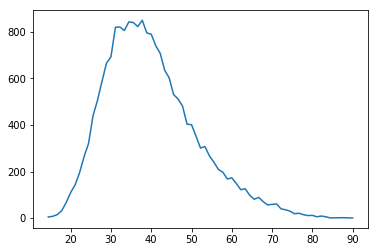
Finally, I plotted the grouped data
%matplotlib inline
import matplotlib.pyplot as plt
plt.plot(df_grouped)
